About product
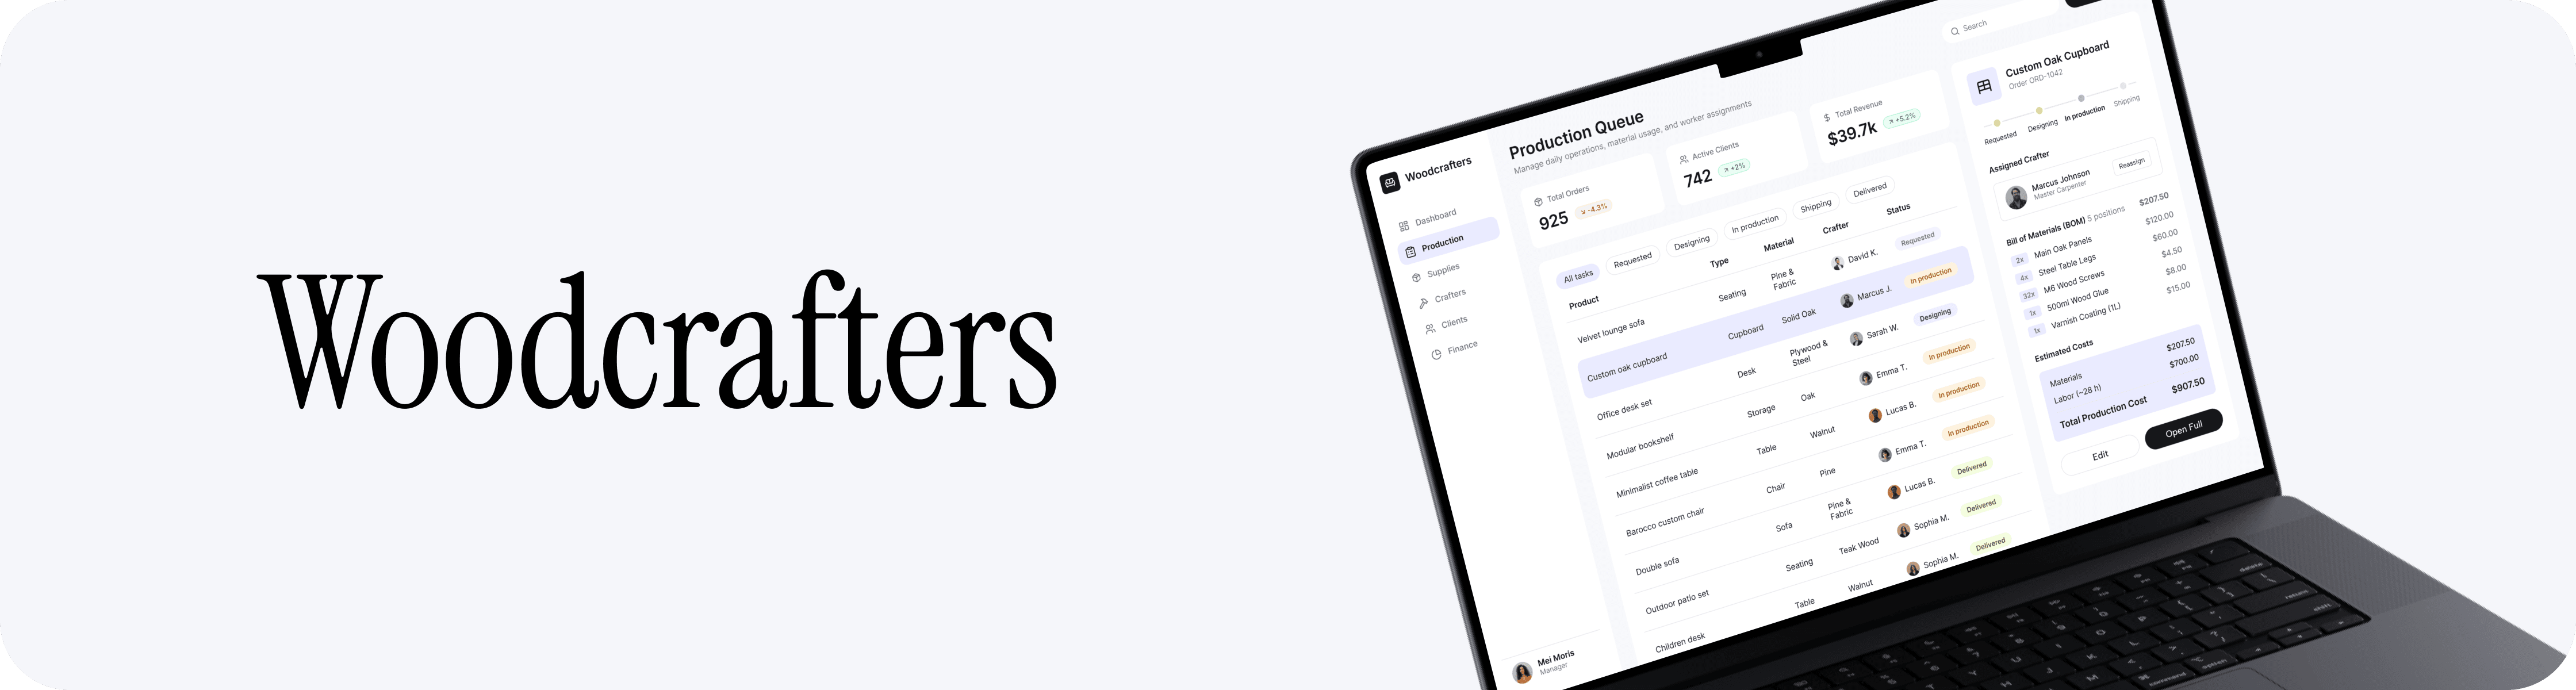
A concept SaaS platform designed to help small furniture workshops manage orders, production workflows, materials, and finances in one system.
The product focuses on improving operational visibility, allowing workshop managers to quickly understand what is being produced, what resources are required, and how the business is performing.
Dashboard
The dashboard was designed to answer the most common questions a workshop manager has at the start of the day:
How many orders are active?
How is the business performing financially?
What needs attention today?
Key metrics are placed at the top of the screen so users can immediately understand the state of the business. Financial trends are shown in a simple chart to provide context without overwhelming the interface.
Operational widgets such as workshop efficiency and upcoming deliveries are positioned on the right side to highlight potential issues that require immediate attention.
The goal was to balance strategic insight and operational awareness within a single view.

Production Queue
The production queue is the main operational workspace. The design prioritises scanability and task visibility.
A structured table layout was chosen because production managers often review many orders at once. Each column highlights a key piece of operational information: product, material, assigned craftsman, and production stage.
Status labels are colour-coded to make production stages easy to recognise at a glance. This allows users to quickly identify delays or bottlenecks.
Detailed order information is shown in a side panel instead of a new page. This keeps users within the production view and avoids disrupting their workflow.

Order Creation
The order creation screen mirrors the real workflow used in workshops when a new project begins.
Information is grouped into logical sections:
Client information
Product specifications
Additional details and documents
This structure helps reduce form complexity and guides users through the process step by step.
A pricing breakdown is displayed alongside the form so users can see how labour and materials affect the final price. This supports better pricing decisions and prevents underestimating production costs.


Supplies Management
Material shortages are one of the most common causes of production delays in workshops.
The inventory interface focuses on visibility of stock levels and restocking needs.
Materials are visualised using simple progress indicators that show current stock levels relative to capacity. Colour coding highlights materials that require attention.
A dedicated alert section surfaces items that need urgent restocking. This ensures that managers can identify supply issues before they affect production schedules.

Purchase Request
The purchase request workflow was designed to ensure that material orders contain all required information.
Users can add multiple items within a single request, specifying supplier details, specifications, quantities and pricing.
A step-based layout helps guide the user through the process and reduces the chance of incomplete requests. Additional notes allow managers to communicate specific requirements to suppliers.
The goal was to make procurement requests clear, structured, and easy to process.


Clients Database
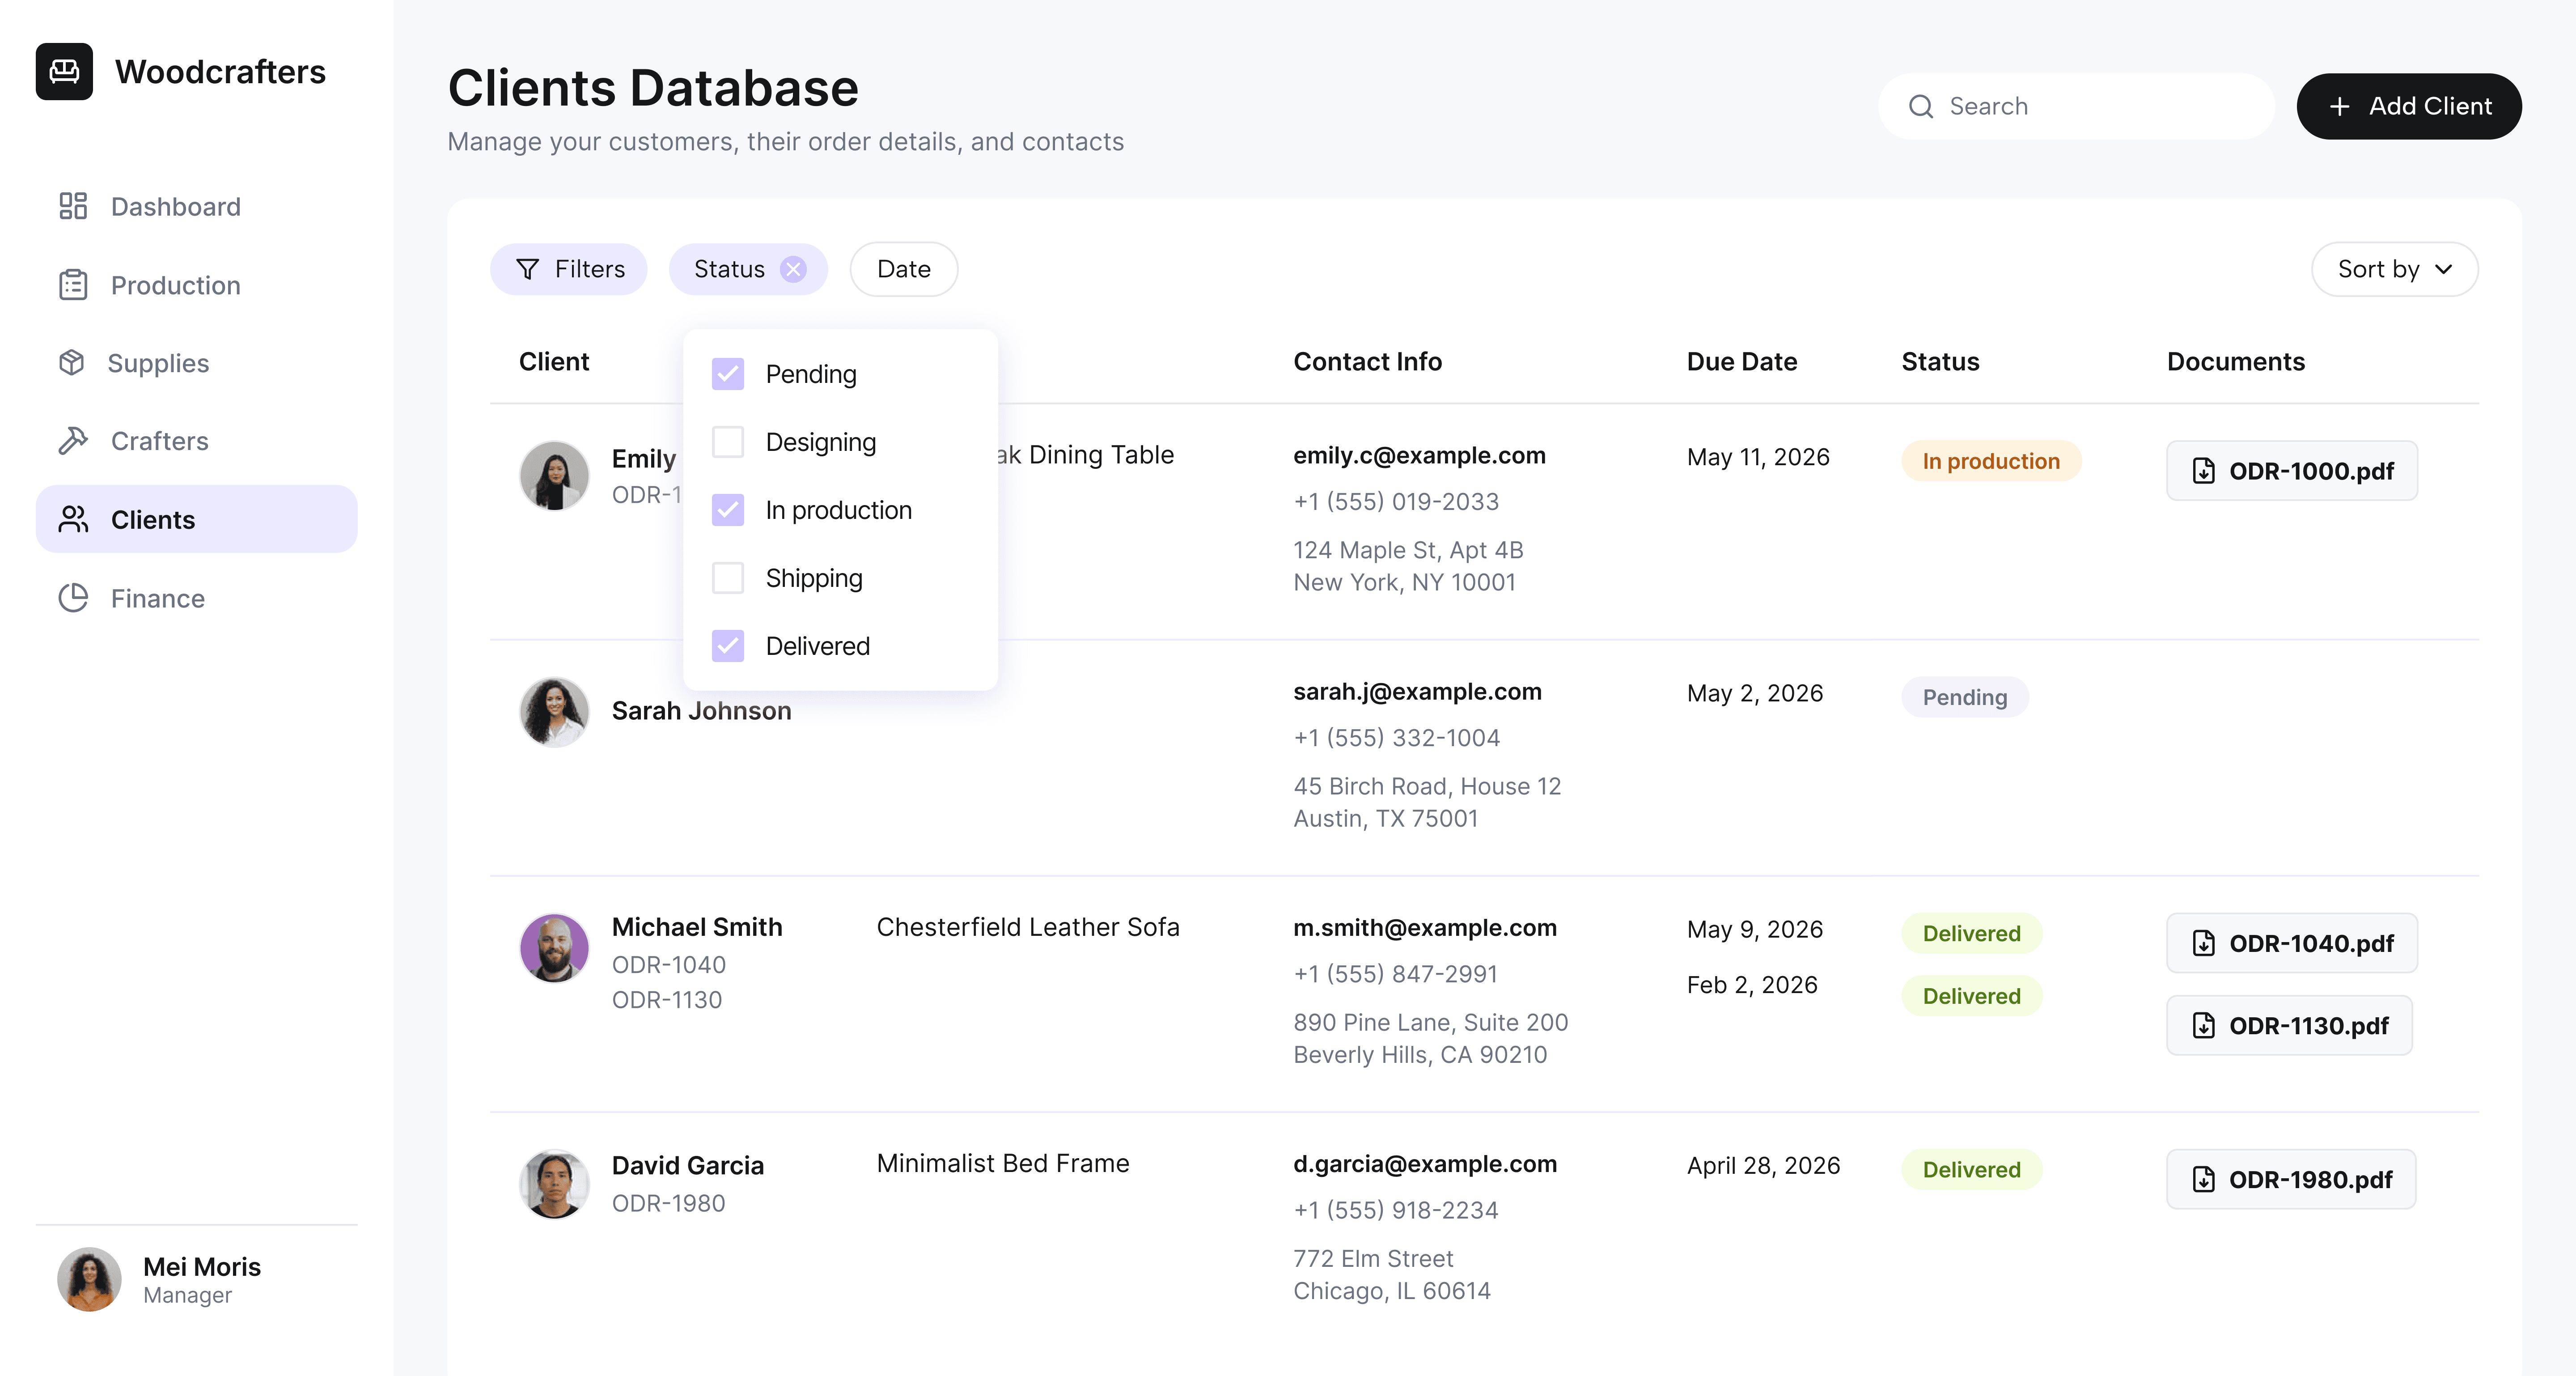
Client information is often scattered across emails, spreadsheets, and messaging tools. The goal of this screen was to centralise customer data while keeping it easy to navigate.
A table layout was used to make client records easy to scan and compare. Important information such as contact details, order status, and delivery dates are visible without opening a separate view.
Filters allow users to quickly narrow the list by order stage or deadline, which is especially useful when tracking active projects.
Documents are attached directly to each record so that order files can be accessed without switching tools.
Financial Overview
Workshop owners often struggle to understand how production costs impact profit. The finance dashboard was designed to make financial performance easier to interpret.
High-level financial indicators are placed at the top to provide a quick snapshot of revenue, expenses, and margins.
The revenue composition chart helps users understand how different cost categories contribute to total expenses. This visualisation makes it easier to identify where the business is spending the most.
Recent transactions are displayed below to maintain transparency and allow quick review of financial activity.
